Profile the population within any drive time, distance radius, or custom area. Exact household counts from 30M+ address records — QGIS-grade accuracy in 60 seconds.
Each report download contains four files giving you everything you need for analysis, presentation and GIS work.
A polished, print-ready one-page summary with your drive time map, key demographics, donut charts for gender, social grade, property and tenure, age distribution, and employment profile. Perfect for client presentations.
Two-sheet Excel workbook: a demographic analysis sheet with key area stats up top, then every field compared against the national average with variance highlighting, plus a sector-by-sector breakdown for all postcodes in the area.
A lo-resolution map image of your drive time polygon on OpenStreetMap. Ideal for quick sharing, embedding in emails, documents, or presentations where file size matters.
A high-resolution print-quality map image of your drive time area. Suitable for large format printing, professional reports and publications. Compatible with Word, InDesign and all major design tools.
Build your catchment on an interactive map, then download a branded PDF summary and a full Excel workbook — here is exactly what you get.
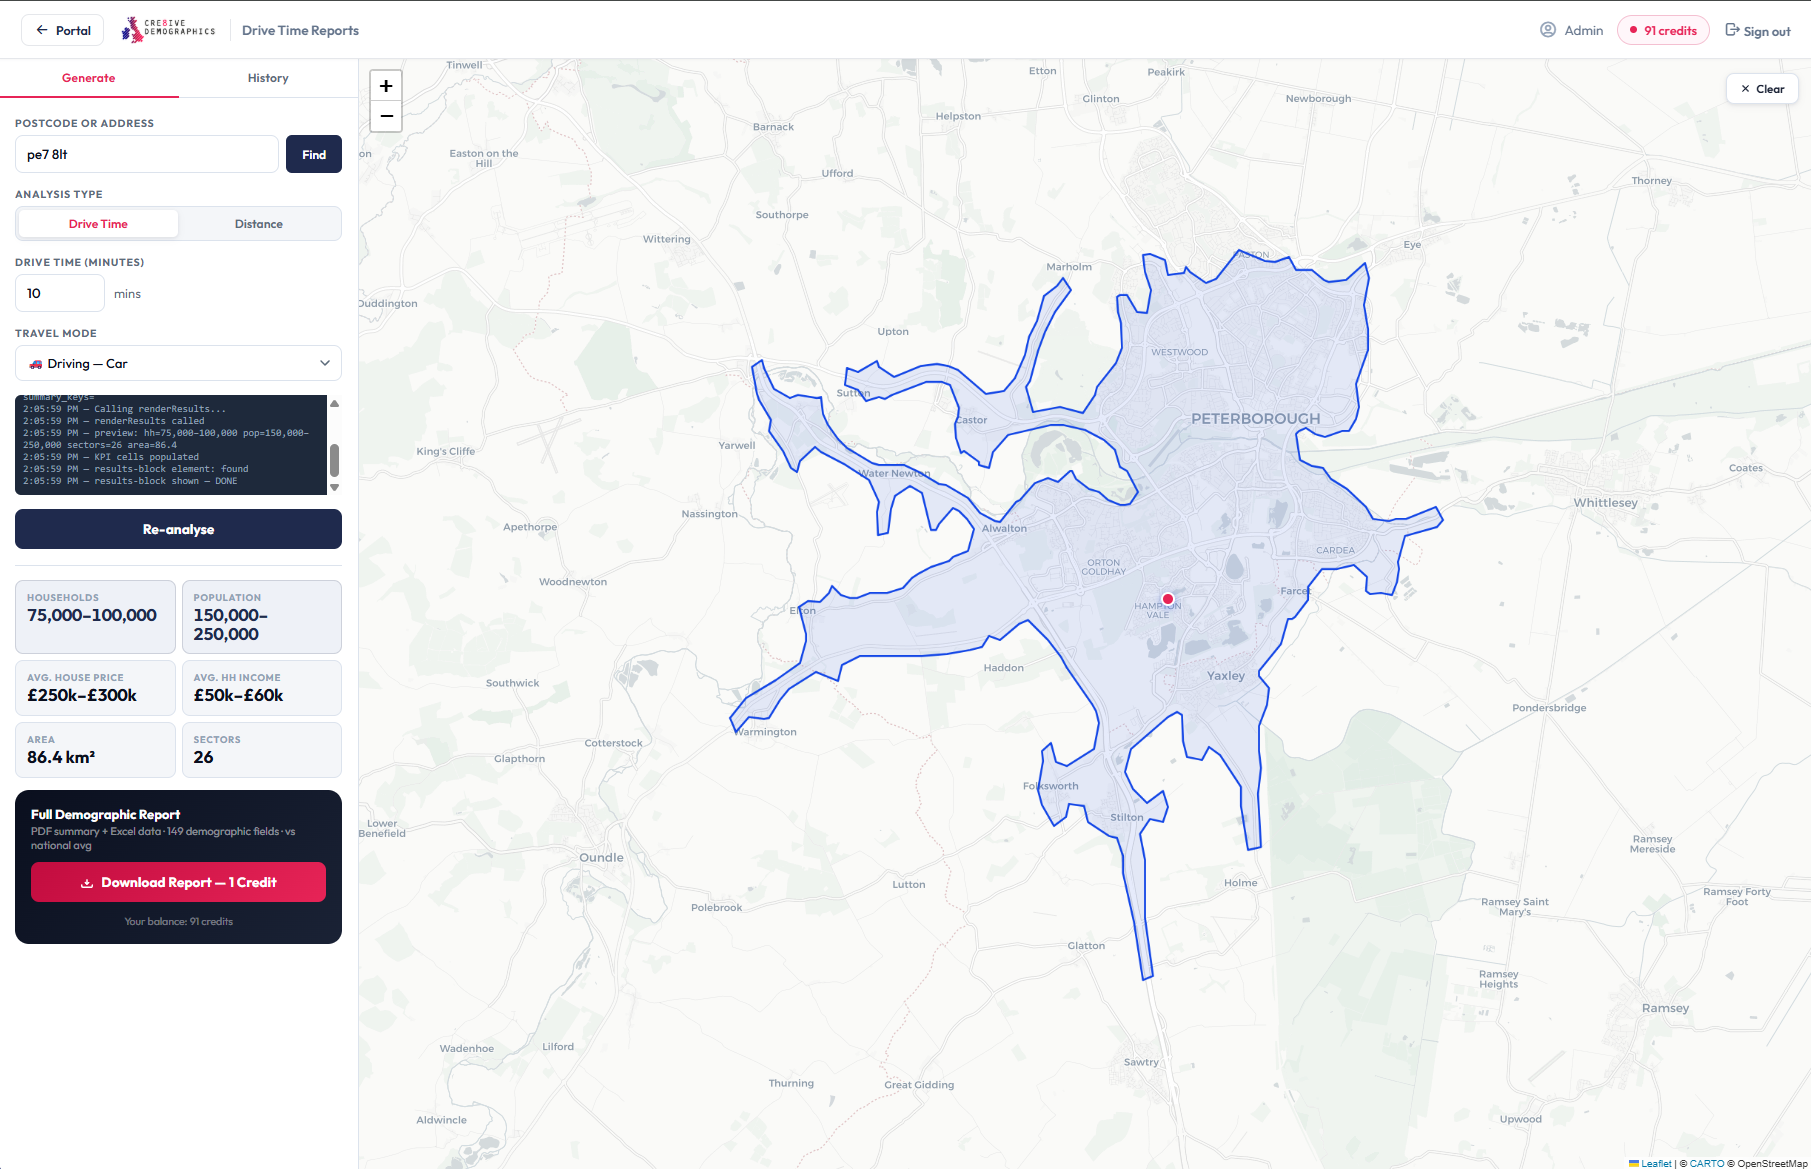
The interactive builder - drop a pin, set a drive time, and watch the catchment and live stats update.
A real report for Peterborough (PE7 8LT, 10-minute drive) — branded PDF, Excel workbook and both map images. No sign-up needed.
Type any UK postcode, street address or place name. The system geocodes it instantly and pins it on the map.
Choose minutes by car, bike, walking, or heavy vehicle — or switch to distance in kilometres. The polygon updates live on the map.
Instantly see households, population, income, house prices, and the list of postcode sectors covered with their individual coverage percentages.
Click download to spend 1 credit and receive your ZIP file containing the PDF, Excel workbook, and both map JPEGs.
Every report draws on 71 demographic variables from the 2026 UK master dataset, compared against national averages so you can instantly see where an area over or under-indexes.
Assess the demographic fit of a potential new site before committing to a lease. Understand who your customers will be, what they earn, and how they shop.
Build data-driven audience profiles for client campaigns. Show clients exactly who lives in their catchment and how they behave.
Evaluate residential and commercial development sites. Understand the local population profile, income levels, and demand drivers.
Profile populations for service planning, resource allocation, and public health campaigns. Compare against national benchmarks.
Access granular postcode-level demographic data for quantitative research. Consistent methodology across England, Scotland, Wales and Northern Ireland.
Deliver faster, data-backed location intelligence to clients. Spend less time in QGIS and more time on insight.
Our household counting method uses a pre-processed index of 30 million+ individual UK address points. Each report performs an exact spatial join — counting only addresses that fall within your drive time polygon, not geographic estimates based on sector coverage percentages.
This gives you the same result you'd get from manually running Extract by Location in QGIS — in under 60 seconds, via your browser.
Confirm your target area is in our dataset and preview key figures before generating a full report.
One credit generates one full report. Buy a pack to suit your volume — the more you buy, the less you pay per report. Credits are shared across your whole company and never expire. All prices include VAT.
Running 100+ reports a month? Contact us for bespoke volume pricing.
Credits are the simplest way to buy drive-time reports. Buy a pack, share it across your team, use them whenever you need.
Purchase a credit pack that suits your volume. The more you buy, the less you pay per report.
All users within your company account draw from the same credit balance — perfect for teams.
Use them now or in six months — there is no expiry date or use-it-or-lose-it pressure.
Each report costs exactly 1 credit. Generate as many as you need, whenever you need them.
Every credit gets you the PDF, Excel workbook, and both map JPEGs — everything in one download.
Regularly running 50+ reports? Contact us for a bespoke volume pricing arrangement.
| What's included | All credits |
|---|---|
| Branded PDF summary report | ✓ |
| Full Excel workbook — 2 sheets | ✓ |
| Map JPEG at 100dpi (lo-res) | ✓ |
| Map JPEG at 300dpi (print quality) | ✓ |
| 71 demographic fields | ✓ |
| Comparison vs national average | ✓ |
| Sector-by-sector breakdown | ✓ |
| Drive time polygon on OpenStreetMap | ✓ |
| Exact household counts — address-level | ✓ |
| Coverage-adjusted demographic weighting | ✓ |
| Report history and re-download | ✓ |
| Shared company credit pool | ✓ |