Report Builder

Build a report for any area you can define

Draw a catchment, set a radius, or select whole postcode sectors, districts, constituencies, counties, wards and built-up areas — then pull a full demographic report for exactly that footprint.

Subscribe →
4
Ways to define an area
10,625
UK postcode sectors
3
Export formats
Unlimited
Reports on subscription
Ways to define your area
Four ways to draw your catchment

However you think about an area — a distance, a shape on the map, or a named boundary — the builder turns it into a single report, household-weighted across every sector it touches.

Radius catchment
◎ Radius

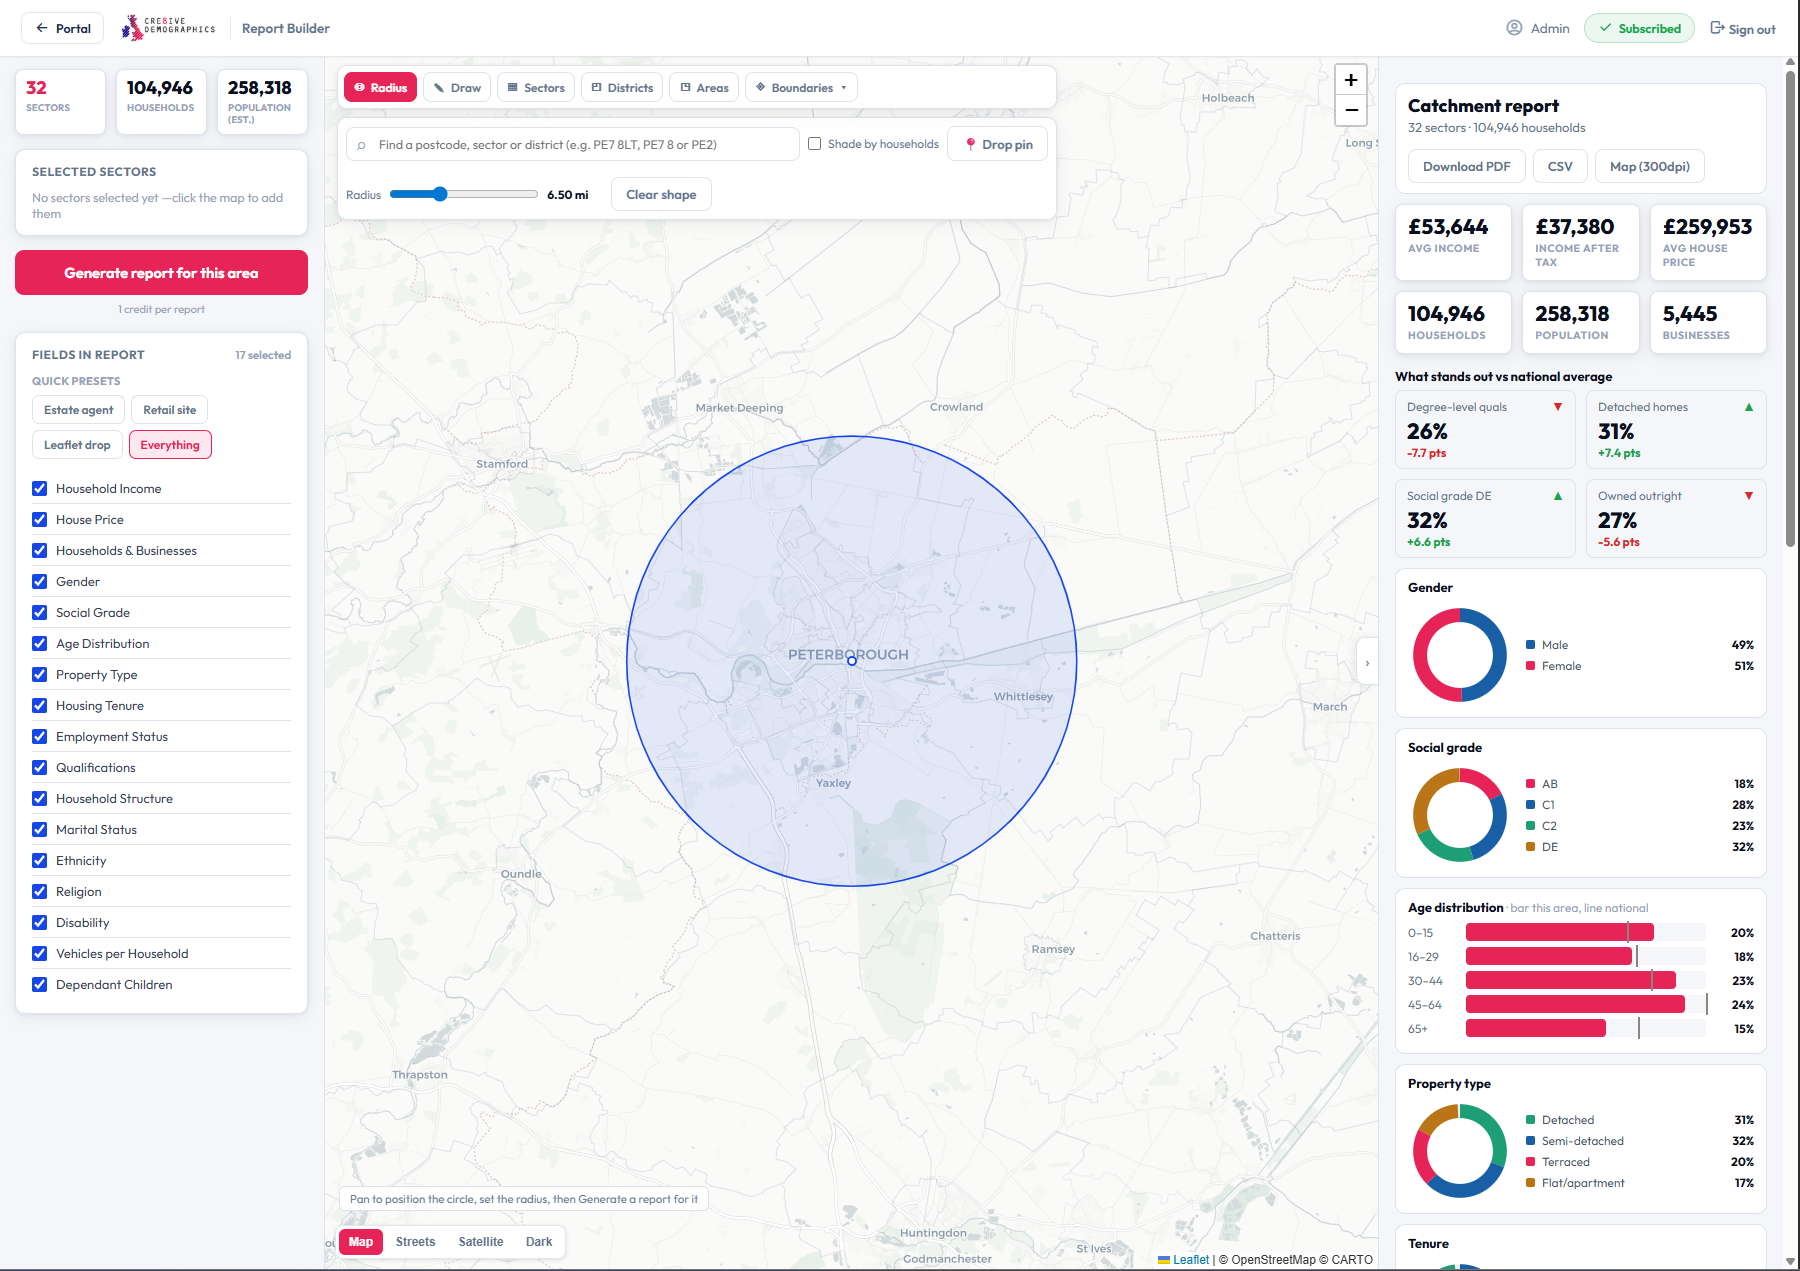
A radius around any point

Drop a pin anywhere — a store, a site, a postcode — and set a distance in miles. The builder captures every postcode sector the circle covers and weights the data by how much of each one falls inside.

Any UK locationDistance in milesCoverage-weighted
✎ Draw

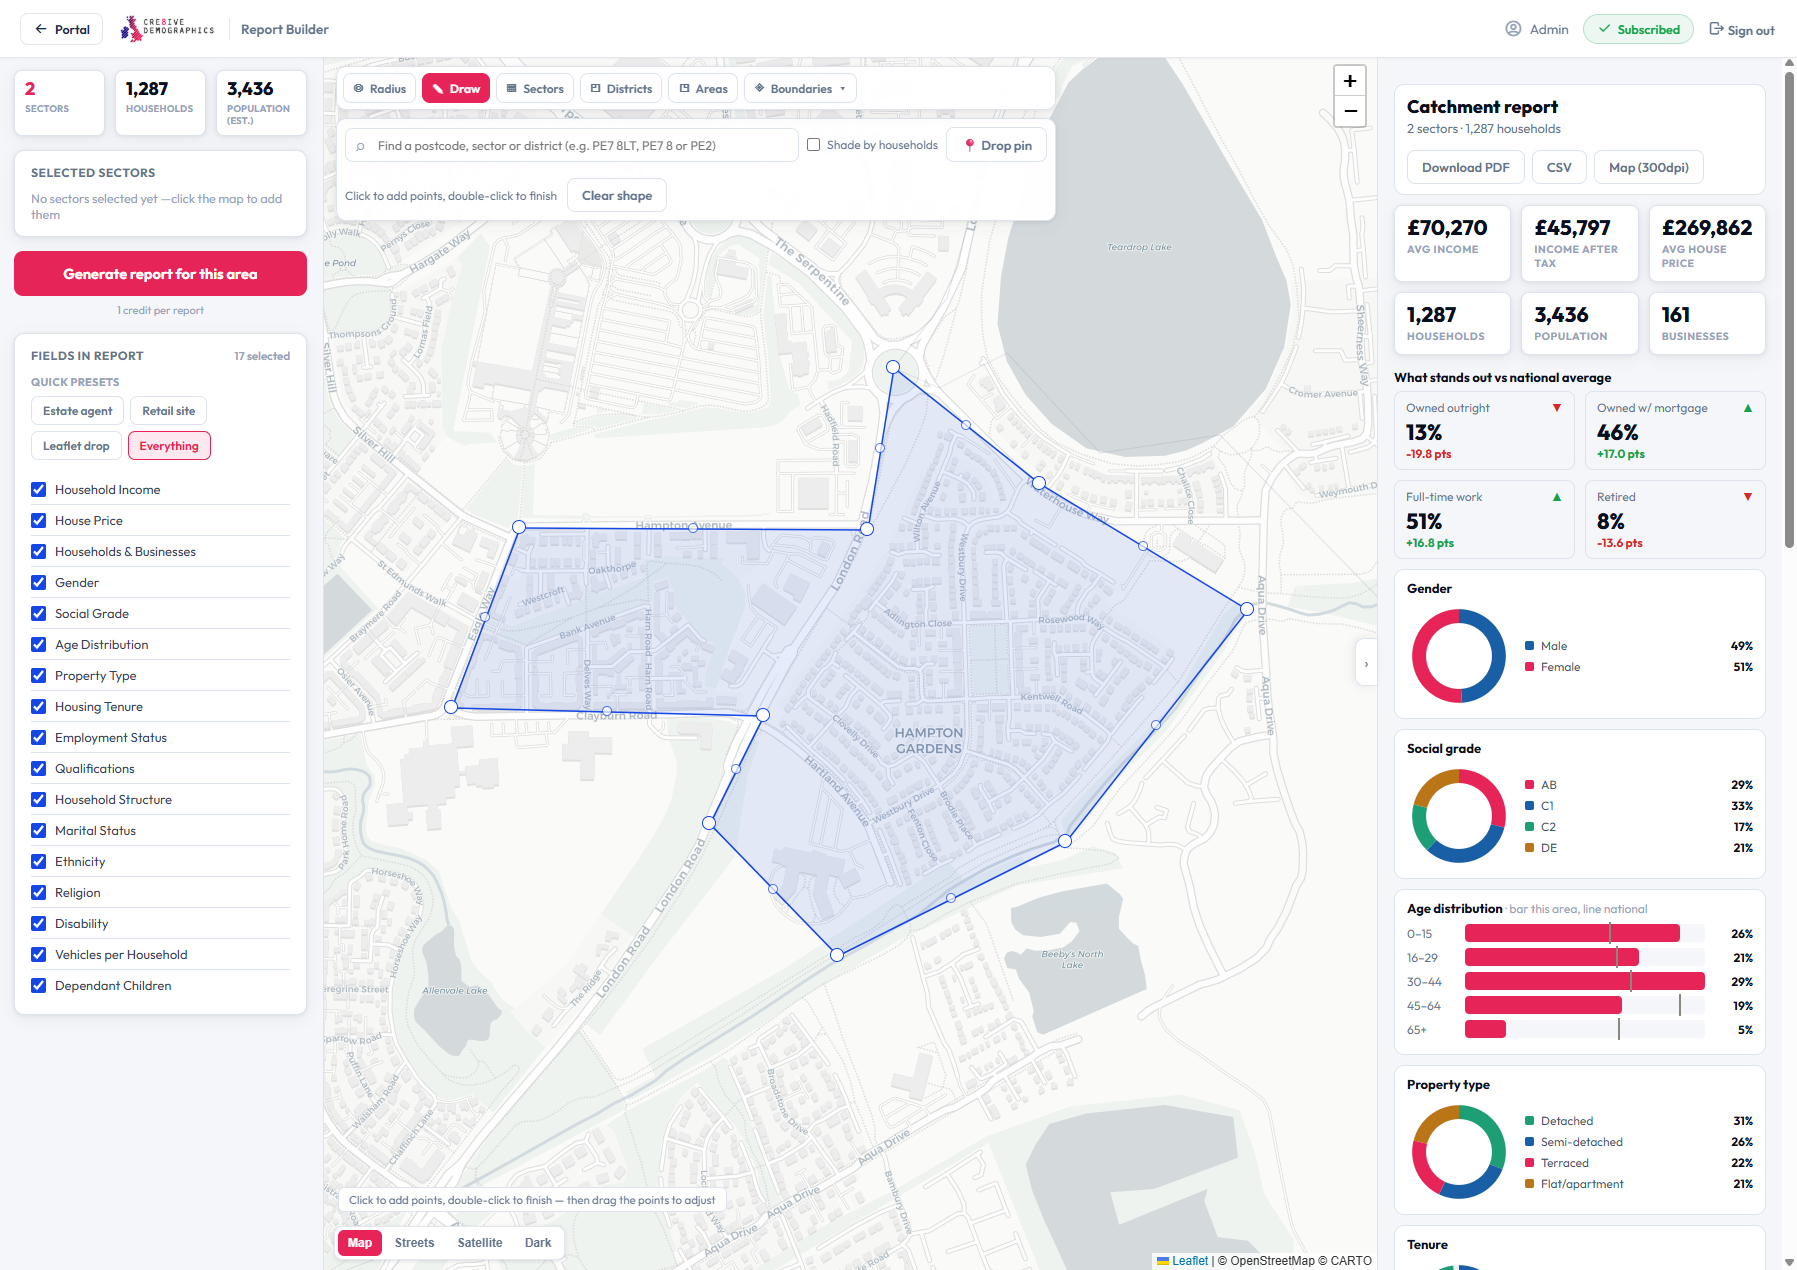
Draw a catchment freehand

Sketch any shape straight onto the map — follow a ring road, a river, a sales territory or a delivery zone. Drag the points until the boundary is exactly right, and the report follows your outline precisely.

Freehand polygonEditable pointsPixel-precise footprint
Draw a catchment
Postcode areas
▦ Postcode areas

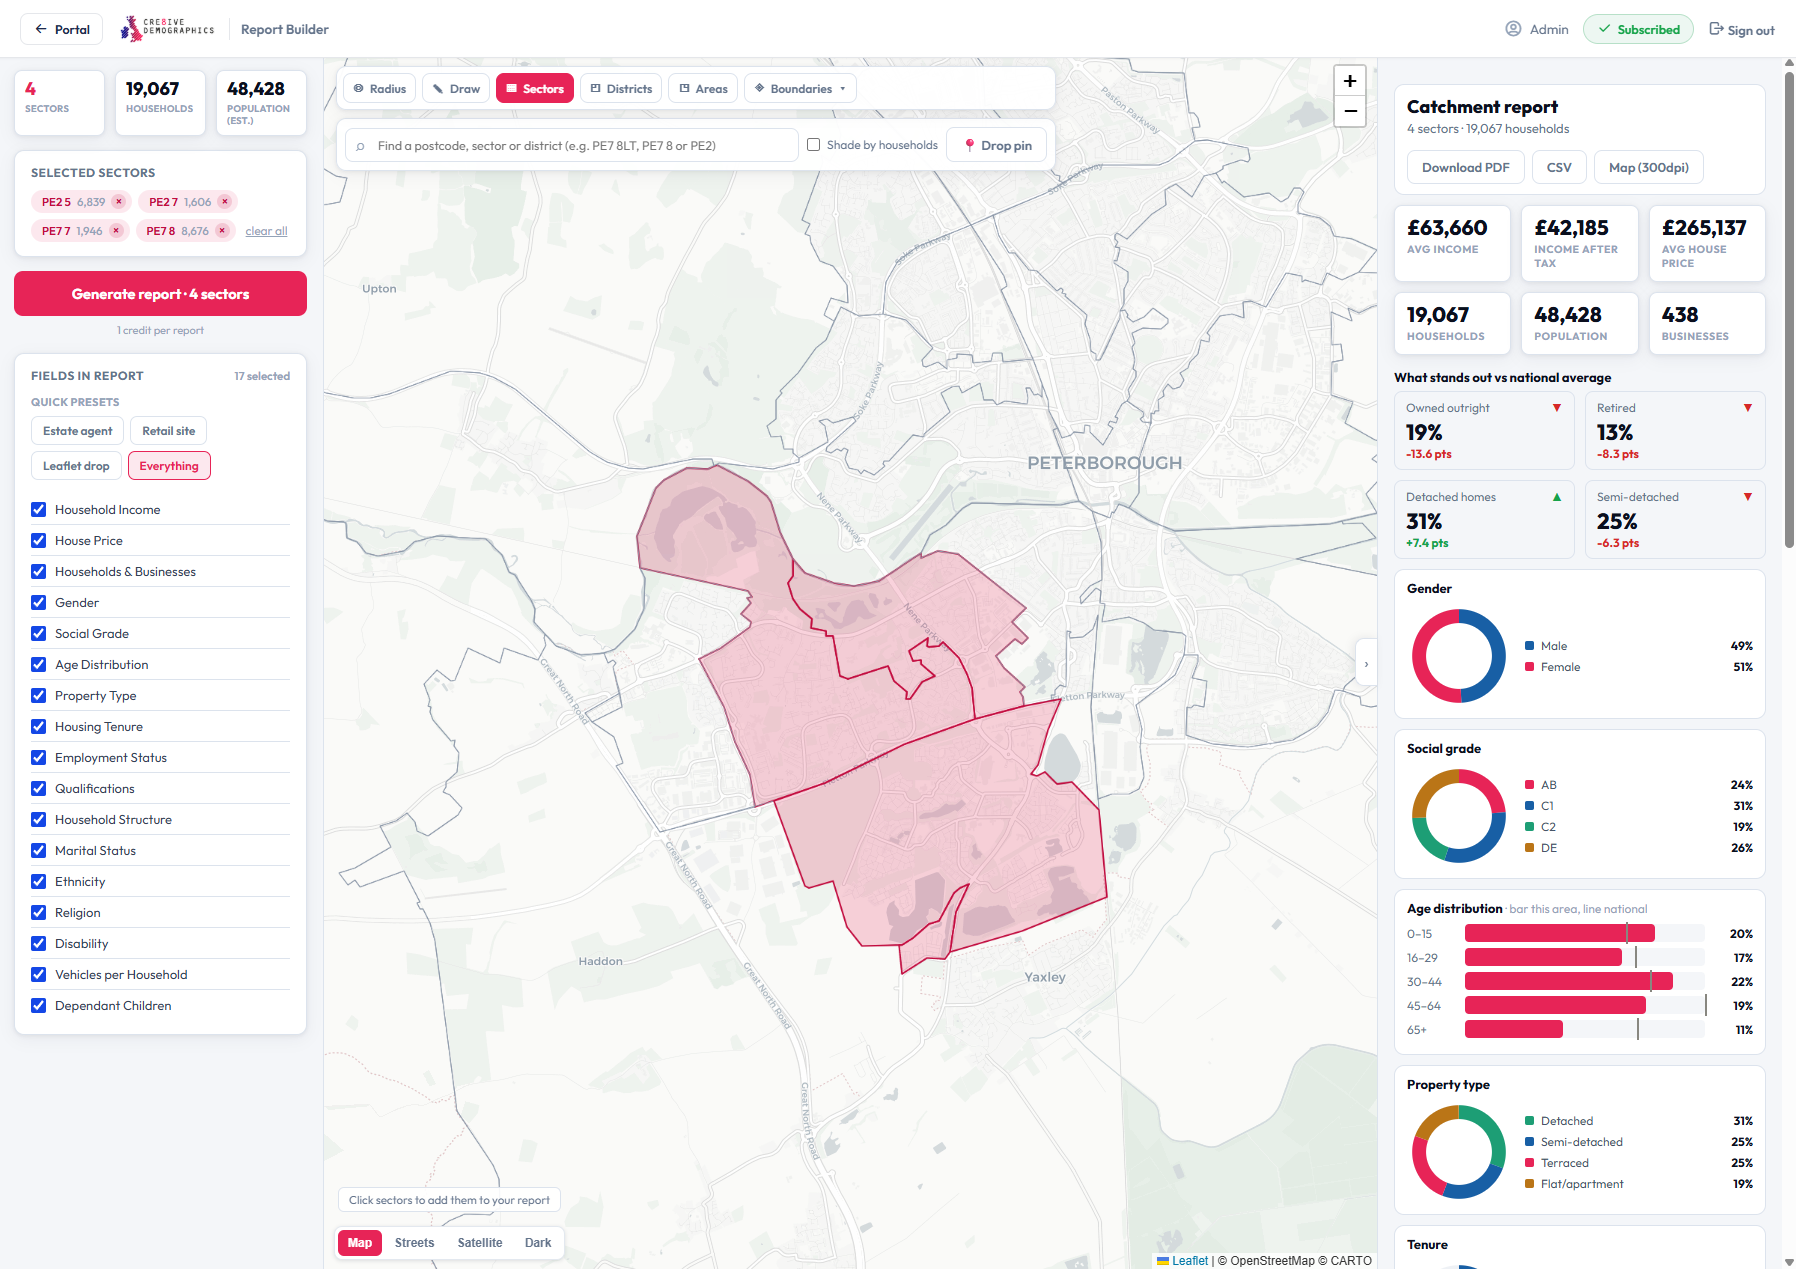
Select whole postcode geographies

Click to build your area from real postcode units at three levels — from a single sector up to a whole postcode area. Ideal when your territories, franchises or distribution rounds are already defined by postcode.

Sector — e.g. PE7 8District — e.g. PE7Area — e.g. PE
◈ Boundaries

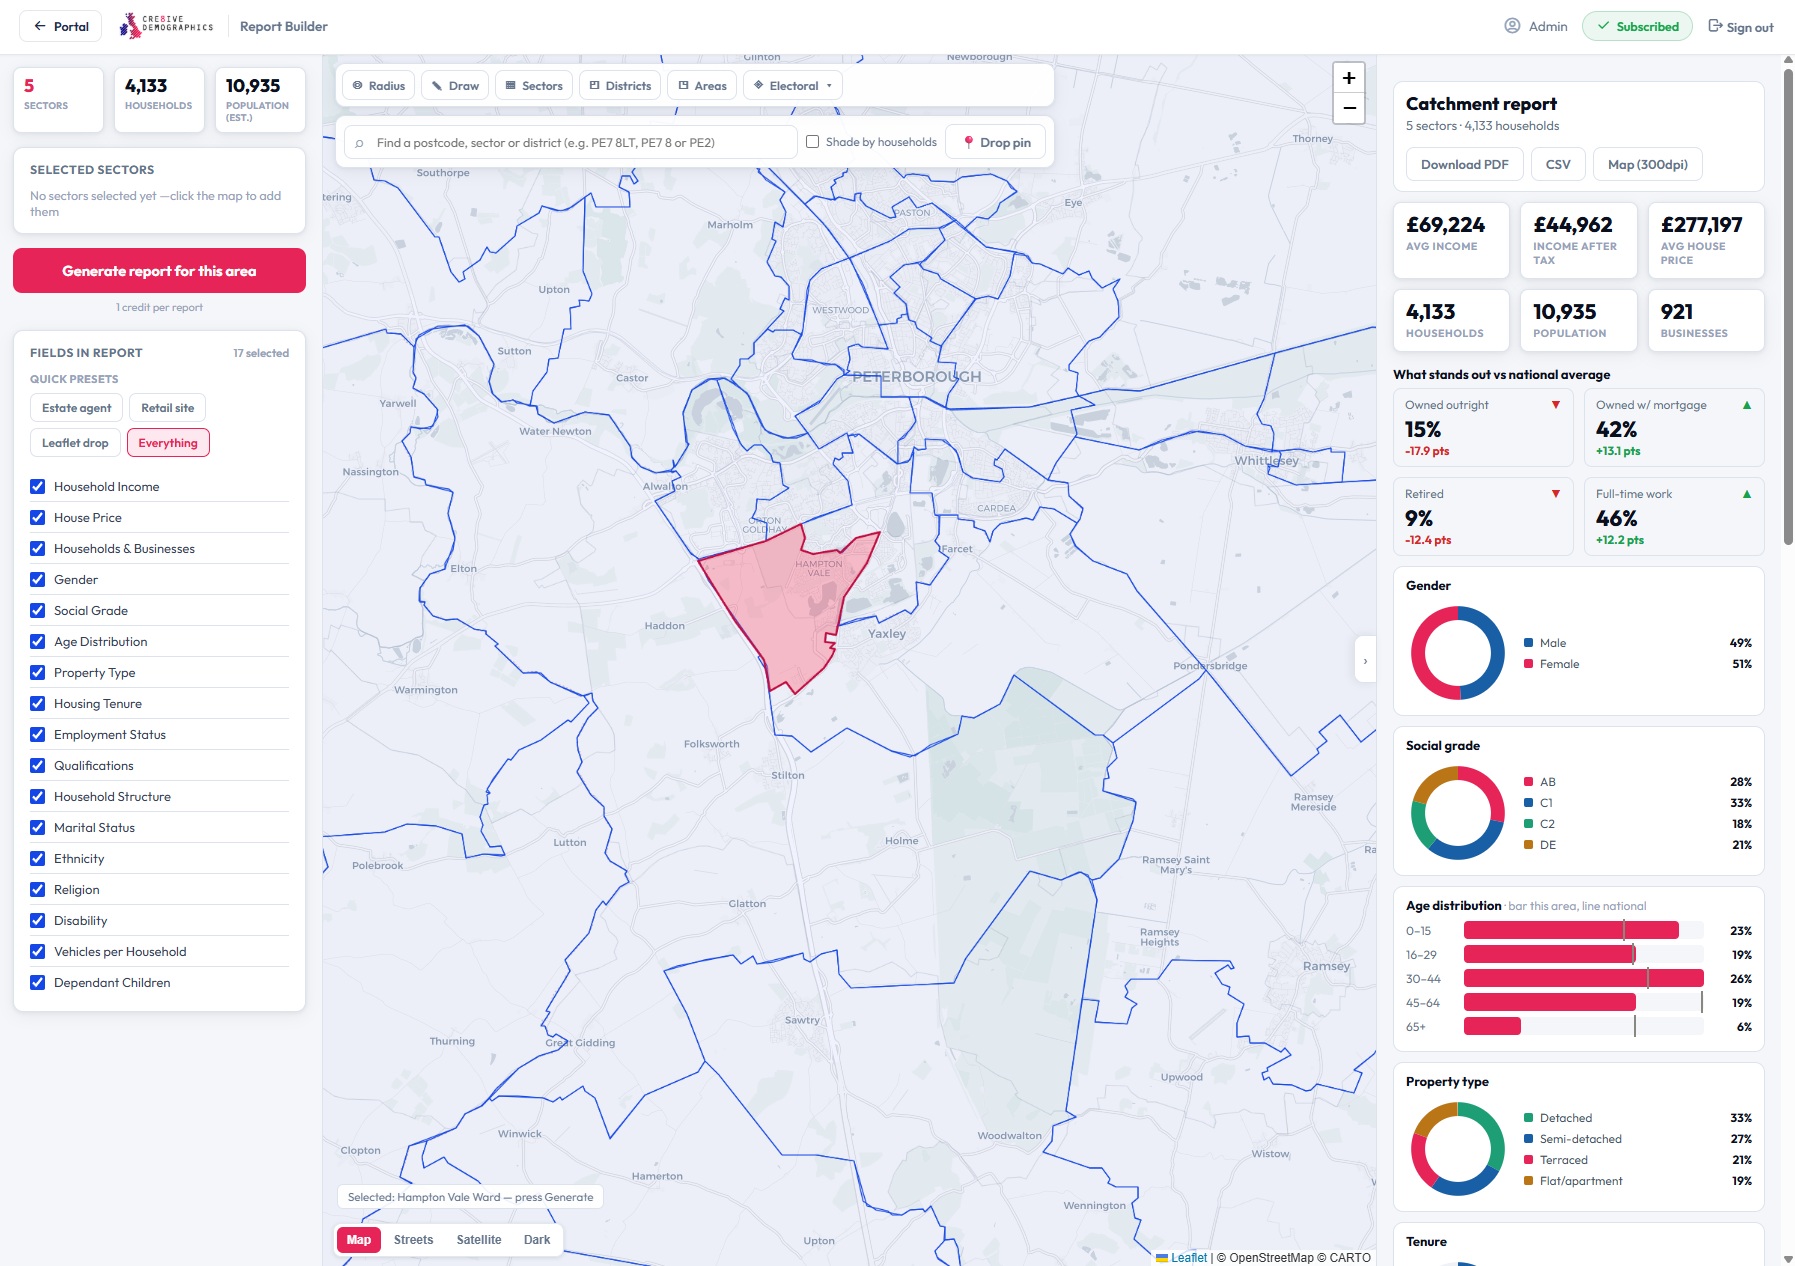
Use official administrative boundaries

Snap your report to recognised UK boundaries — pick a parliamentary constituency, a county, a built-up area or an electoral ward and the builder selects every sector inside it. Perfect for public-sector, planning and media work that has to line up with official geographies.

ConstituenciesCountiesBuilt-up areasElectoral wards
Administrative boundaries
What you get out
Three ways to take your data away

Every area you build can be exported as a branded PDF, raw CSV data, or a high-resolution map image — ready for decks, spreadsheets and print.

Sample PDF report

📄 PDF report

A branded, presentation-ready report for your area — key stats, demographic breakdown vs the national average, charts and a map. Drop it straight into a proposal.

Download sample PDF →
Sample CSV data

📊 CSV data

Every selected sector as a row, with the exact in-catchment household count and the fields you chose. Open in Excel, pivot it, or feed it into your own models.

Download sample CSV →
Sample high-res map

🗺️ High-res map

A 300 dpi map image of your catchment on a clean basemap — sharp enough for print, slides and large-format boards.

Download sample map →
Data included
A full demographic profile of your area

Whatever footprint you build, every report is household-weighted across the sectors it covers and benchmarked against the UK average.

👥

People & social grade

Population, gender split and the full AB–DE social grade profile for your area.

📈

Age distribution

Age bands from under-5 to 80+, charted against the national average.

🏠

Property & tenure

Housing mix from detached to flats, and owned outright through to rented.

💼

Employment

Full-time, part-time, self-employed, retired and student shares across the area.

🎓

Qualifications

Highest qualification levels, from none through to degree level and above.

👪

Households & children

Household structure, composition and the presence of dependent children.

🚗

Vehicles

Car and van availability per household across your selected footprint.

🌍

Ethnicity & religion

Ethnic group and religion breakdowns where you choose to include them.

💰

Economic indicators

Average house price, household income and household size for the area.

Pick exactly which fields appear with one-click presets — estate agent, retail site, leaflet drop — or choose your own.

How it works
From map to report in four steps
1

Define your area

Radius, freehand draw, postcode areas or an official boundary — whatever fits.

2

Choose your fields

Use a preset or tick exactly the datasets you want in the report.

3

Generate live

See the full profile on screen instantly, benchmarked against the UK average.

4

Download

Export as a branded PDF, CSV data or a high-res map image.

Who uses it
Built for anyone working to a catchment
🏬

Retail & site selection

Profile the catchment around a store or a potential site before you commit.

📬

Direct mail & leaflets

Size and profile a distribution area, then export the sectors to brief your drop.

🏡

Estate & lettings agents

Show vendors and landlords exactly who lives in a defined patch.

📺

Media & planning

Align audiences to wards, constituencies and built-up areas for campaigns.

🍔

Franchise & territory

Define and compare territories by postcode area or a drawn boundary.

🏛️

Public sector & research

Report to official geographies — counties, constituencies and electoral wards.

Pricing
One subscription, unlimited reports

The Report Builder is subscription-only — build as many areas and pull as many reports as you like, shared across your whole company.

Monthly
£99.00/mo
unlimited reports
  • Unlimited custom-area reports
  • All 4 ways to define an area
  • PDF, CSV & high-res map exports
  • Shared across your whole company
  • Cancel anytime

Prices include VAT · shared company-wide · cancel anytime.

FAQ
Common questions
How is the data calculated for a custom area?
Your area is matched against every postcode sector it touches. For drawn shapes and radii, each sector is weighted by how much of it falls inside your boundary; for postcode and boundary selections, whole sectors are included. Everything is benchmarked against the national average.
How is this different from a Sector or Neighbourhood report?
Those cover one fixed geography. The Report Builder lets you define any custom footprint — a radius, a drawn catchment, or a group of postcode areas and boundaries — and reports across all of it at once.
Can I export the data?
Yes — every area can be downloaded as a branded PDF, a CSV with one row per sector, and a 300 dpi map image.
Is there a per-report charge?
No. The Report Builder is a subscription — once active, everyone in your company can build unlimited areas and reports with no per-report fee.
Get started

Ready to build your first catchment?

Subscribe for unlimited custom-area reports, shared across your whole company.

×Full size