Instant demographic PDF for any UK postcode sector. Full 64 field breakdown vs national average, sector boundary map, and key statistics.
Preview any sector live on screen — 64 fields vs the national average, a boundary map and key stats — then download the full branded PDF. Here is a real example.
The live report view for Peterborough (PE7 8) — click to view full size.
A real PE7 8 sector report. No sign-up needed.
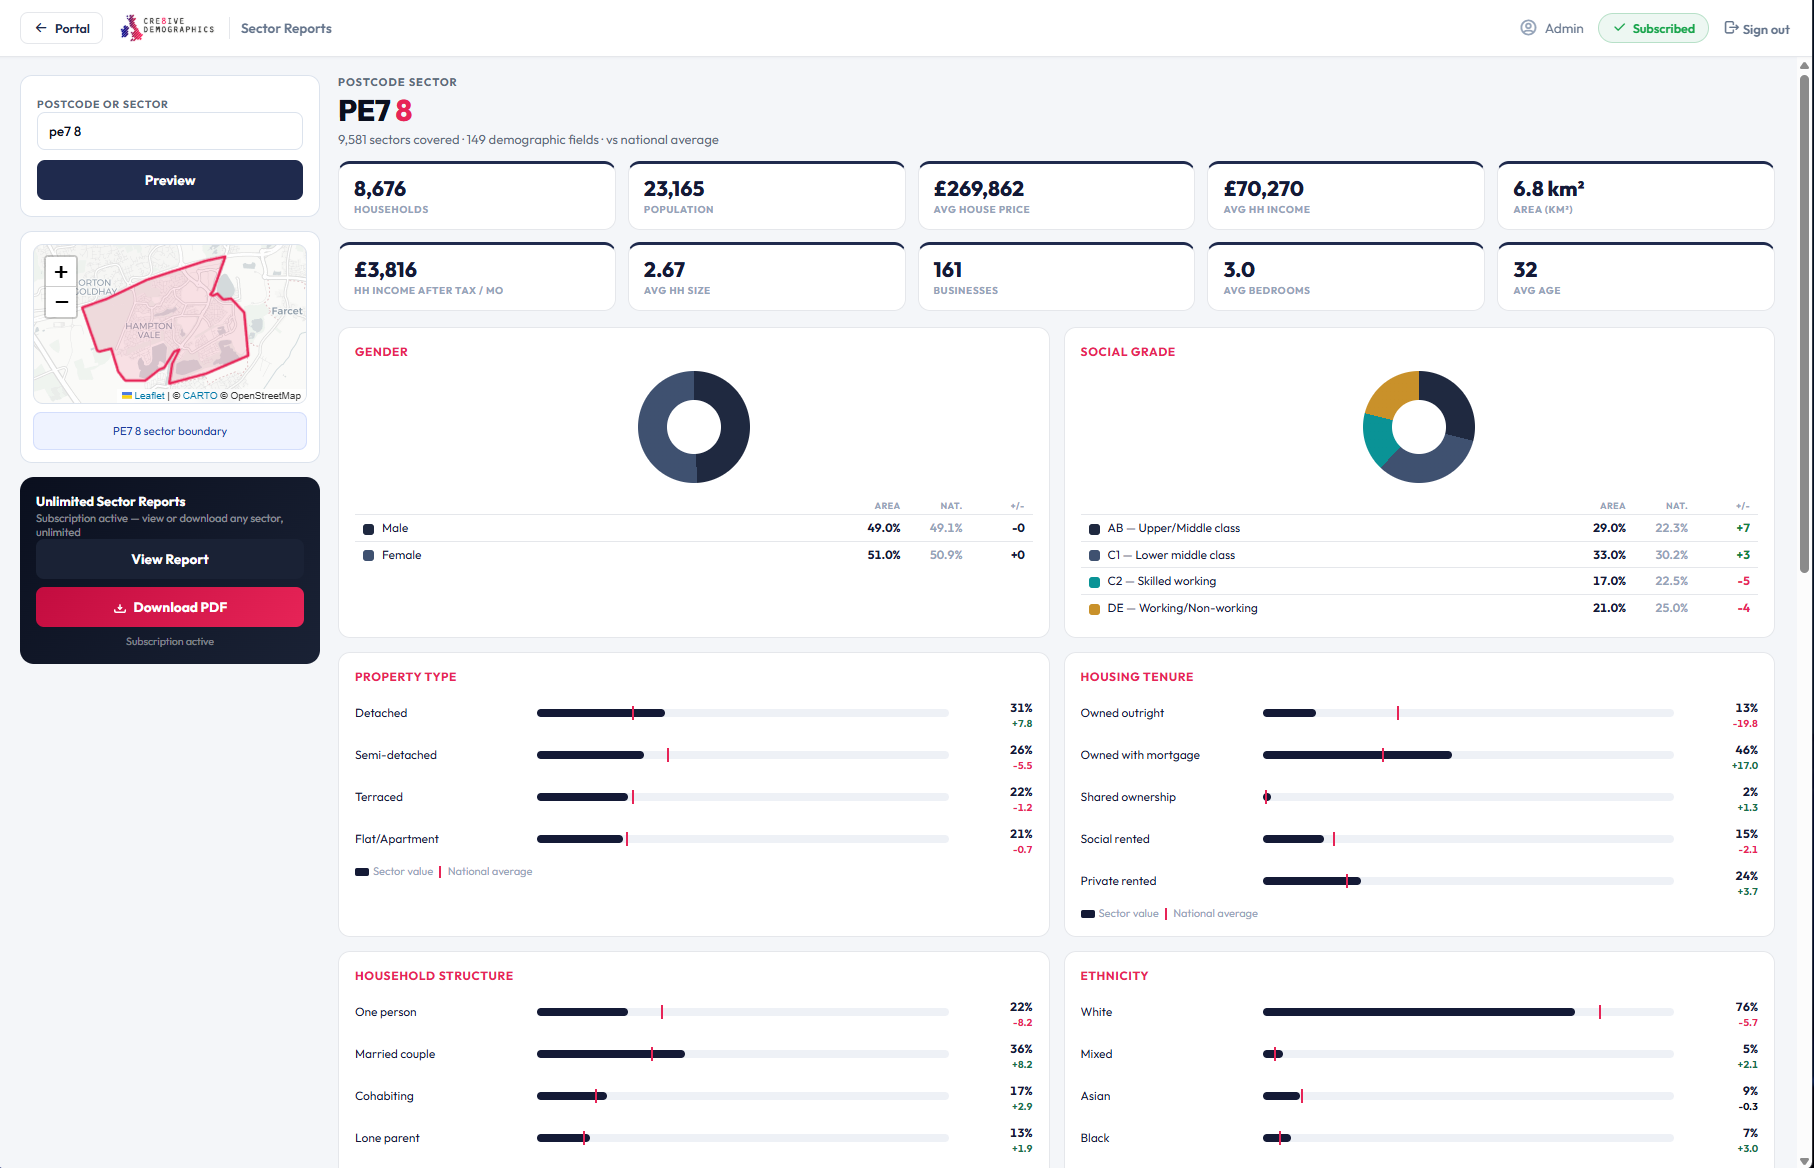
A complete demographic profile of your chosen postcode sector — 64 fields benchmarked against the national average, with charts, a boundary map and key statistics.
Your postcode sector outlined on an OpenStreetMap background, ready to drop into a deck or proposal.
64 fields across gender, social grade, age and more — each compared to the UK average.
Average house price, household income and household size for the sector at a glance.
The full housing mix — detached through to flats, owned outright through to rented.
AB–DE social grade profile and employment status, benchmarked nationally.
16 age bands charted against the national average to show how the area skews.
Type any UK postcode or sector, like PE7 8 or SW1A 1.
See the headline stats and a locked preview instantly — no account needed.
Checkout with Stripe and agree the simple single-use licence.
Your branded PDF is generated and ready to download immediately.
Grab a single sector report, or subscribe for unlimited reports across your whole company — monthly or annual.
Subscriptions give everyone in your company unlimited sector reports · prices include VAT · cancel anytime.
Enter any UK postcode or sector to see the headline stats instantly, then download the full PDF.
Whenever a decision comes down to who actually lives in an area, a sector report has the answer.
Size up the catchment around a prospective site before you commit to a lease.
Target the sectors whose profile matches your best customers and skip the rest.
Brief vendors and buyers with credible, local demographic context.
Compare candidate territories on income, age and social grade side by side.
Tailor messaging and media to the real make-up of each neighbourhood.
Evidence funding applications and reports with sourced local statistics.
Confirm your target area is in our dataset and preview what data we hold.